Simple and Elegant
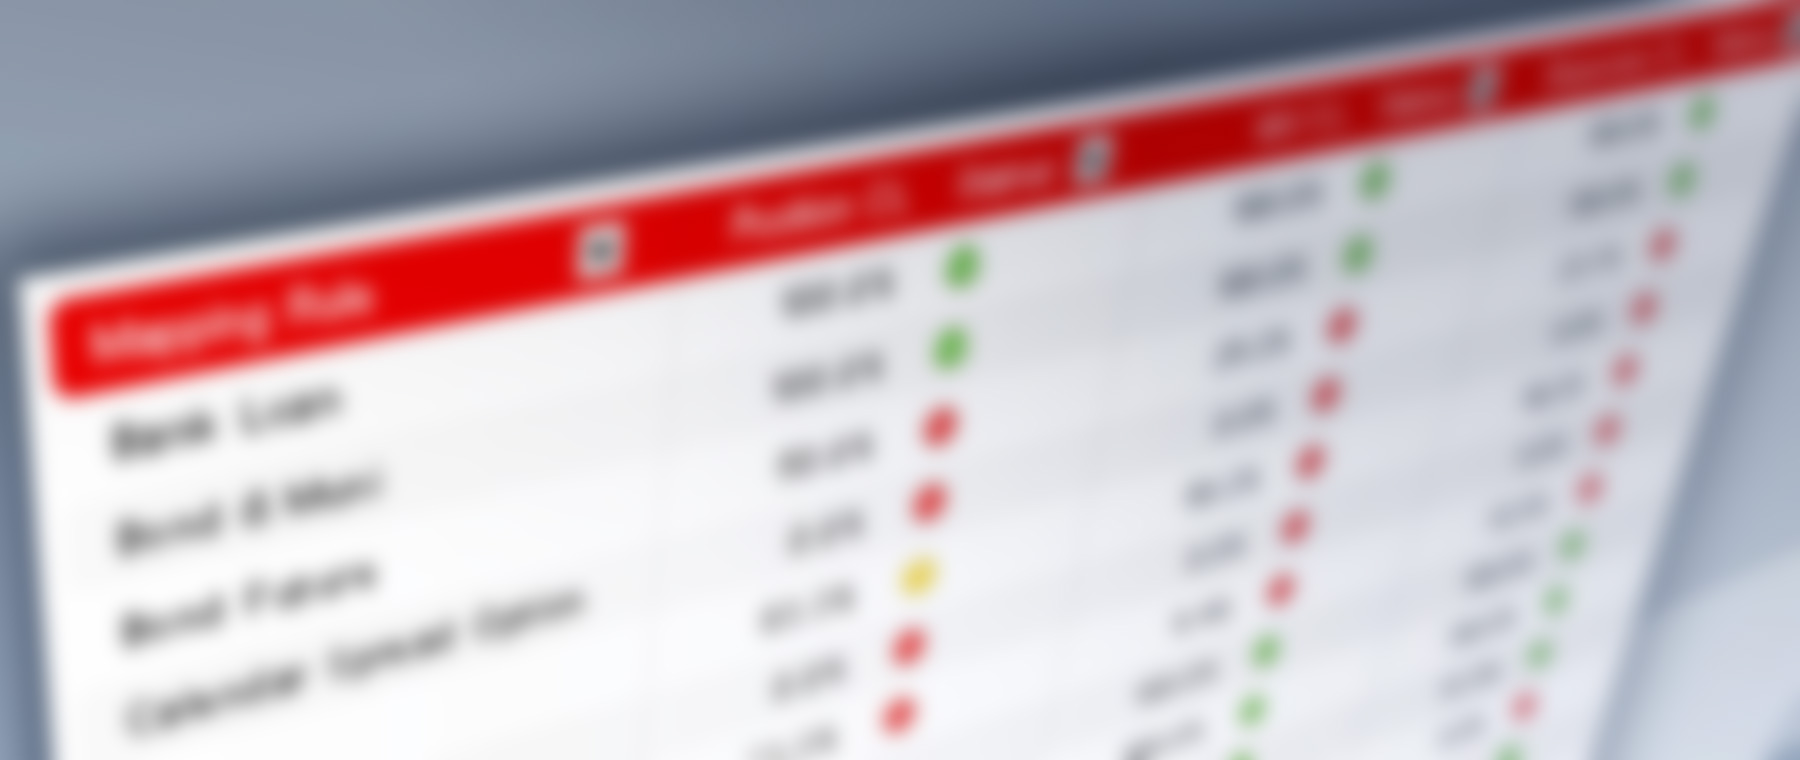
- Data visualization used to condense vast amounts of data into single dashboard
- Logical drill-down into pre-defined data visualizations assist in analyzing cause of changes down to position level
Powerful
- Z-scores used to normalize all risk statistic values and quickly identify outliers
- Entire history of all risk report stats
- Quickly analyze entire Z-score history
- Log files messages are categorized and organized in flexible report for quick analysis and error remediation
- Process time records help identify source of delayed reports
Highly configurable
- Choose any statistics from RM report
- User configurable Z-score levels and analysis periods
- Include PnL data for VaR exception monitoring
- Limit testing based on user defined rules (i.e. VaR limits)

